
My "notes" based on the Paint Shop Pro 9 Help Files (available both within PSP9 and in the printed manual).
I'm going to post this to my blog for easy access.
Here's some of the relevant text to go along with the image:
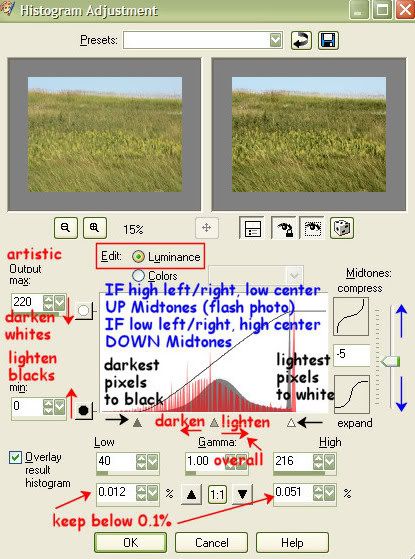
Adjust > Brightness and Contrast > Histogram Adjustment
Luminance Lightness values of the image. If you are correcting contrast, start with this channel.
Color Pick a color channel from the drop-down list: Red, Green, or Blue.
On the left side of the histogram, look for a gap between the left edge and the point where the graph starts to rise. If there is a gap, it shows that the darkest pixels in the image are not completely black. Click and drag the Low slider (the black triangle) to the point where the graph rises. The top Low edit box displays the low position (from 0 to 255). The bottom edit box displays the percentage of pixels that are between zero and the low value; their contrast will be lost. As a general rule, keep the percentage below 0.1%.
On the right side of the histogram, look for a gap between the right edge of the window and the point where the graph decreases to zero pixels. If there is a gap, click and drag the High slider (the white triangle) to that point on the graph. This changes the lightest pixels in the image to white. As a general rule, keep the High percentage change (the bottom edit box) to below 0.1%.
If the overall image is too dark or too light, adjust the gamma. (Gamma is a standard measure of change in an image’s contrast.) If the image is too dark, drag the Gamma slider (the grey triangle) to the right to increase the gamma (the number changes in the Gamma edit box). If the image is too light, drag the Gamma slider to the left to decrease the gamma.
If the graph has peaks on the left and right sides and contains low points in the center, the midtones need to be compressed. Shadows and highlights need to be expanded to reveal the information they contain. This often occurs in flash photography when a subject is too close to the camera; the subject appears brightly illuminated but the background of the photograph is very dark. To compress the midtones, click and drag the Midtones slider up.
If the graph peaks in the center and has a low number of pixels at the left and right sides, expand the midtones by dragging the Midtones slider down.
If you are improving your image, skip this step. If you are creating artistic effects, use the Output Max and Min sliders on the left side of the histogram to make further adjustments. The Max slider is the white circle within a grey square; the Min slider is the black circle within a grey square. To darken the image’s whites, click and drag the Max slider down. To lighten the image’s blacks, click and drag the Min slider up. (pg149-150 printed manual)
Guidelines for Analyzing the Histogram
The usefulness of the histogram depends upon the image content as well as its channel values. For example, an image of pale, desaturated skin tones may display a big saturation peak on the left side (in the lower values) of the histogram. An image of a bright red fire engine may display a peak on the right side (in the higher values) of the histogram. If the images were improperly saturated, the saturation histograms might be reversed. (pg148 printed manual)
No comments:
Post a Comment